Automa – Italy – Monitoraggio e telecontrollo reti oil, gas, water

Cathodic Protection

By Ivano Magnifico, Product Manager AUTOMA
From the presentation “Back to the future: when the past is already the future”
SMART GRID DAYS 2025, 8 – 9 October 2025.

Are we using the data we receive from the monitoring systems of cathodic protection as we should? To understand this, let’s summarise the history, the current situation and the future of pipeline monitoring, particularly focusing on what we take for granted and what seems normal because we see it every day.

In this article and the next, we will talk about the monitoring methods and how it is possible to optimise data transmission.

With this content, we are mainly addressing foreign readers, who have different management practices than those we have in Italy. However, in any case, the recap can also be useful for us Italians to see if we are working to the best of our abilities.

Definition of Remote Monitoring

UNI EN ISO 15589-1:2017 proposes this definition of remote monitoring: “At a minimum, remote monitoring must provide the same level of information obtained by cathodic protection operators in the field”.

What does this mean? The “minimum” is a precise measurement taken at the same frequency with which a technician can go out into the field to carry out checks. Relying solely on this standard means taking things a bit too literally: you can imagine what it means to take a precise measurement every six months, considering everything that can happen in the meantime.

There is no definition of remote monitoring in the NACE standards. However, there is a working group that has the task of drafting the MR21551 standard on remote monitoring. When this standard is drafted, you will find that there is some reference to what we do in Italy.

RMU vs Datalogger

When we limit ourselves to what the standard requires, we are faced with a contrast between what a remote monitoring unit (RMU) does, which takes measurements from time to time, and what a data logger does, which analyses the effects of interferences with high-frequency measurements. Normally, one faces a dilemma: which one to choose?

If we choose a remote monitoring unit, we limit ourselves toperiodic measurements withlow transmission requirements, but we forego high-frequency sampling. If we choose adata logger, we will have high sampling frequencies and an assessment of transienteffects, but data retrieval will be difficult and usually done manually, as the device does not have remote access.

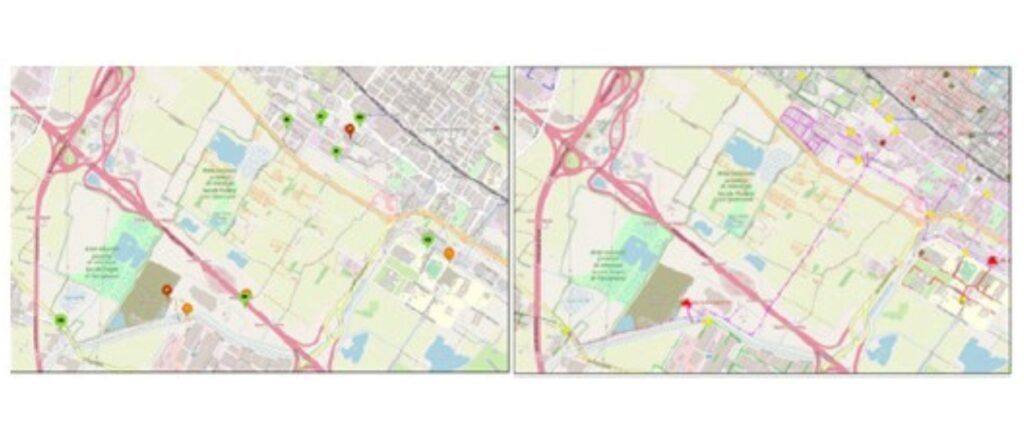
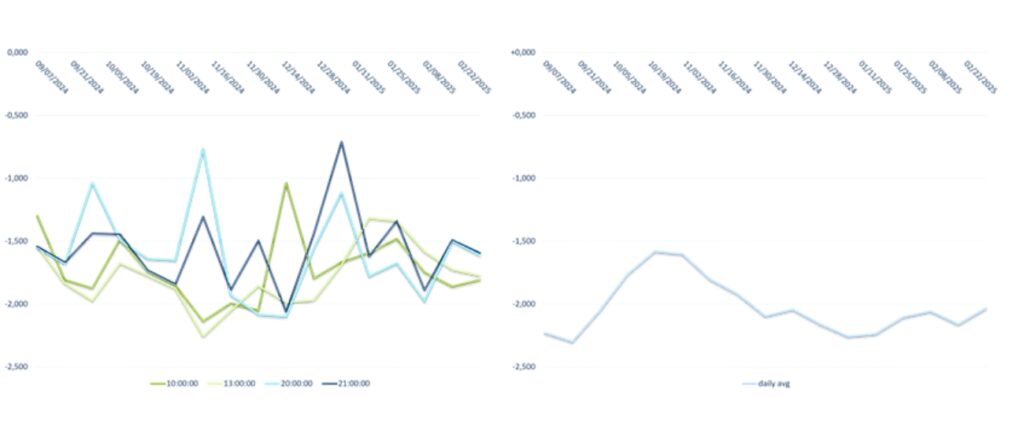
ON potential trend on structure

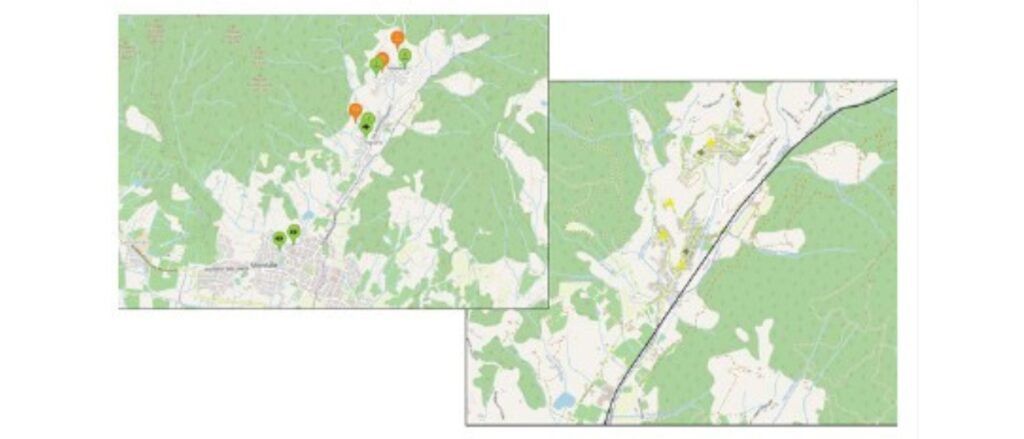
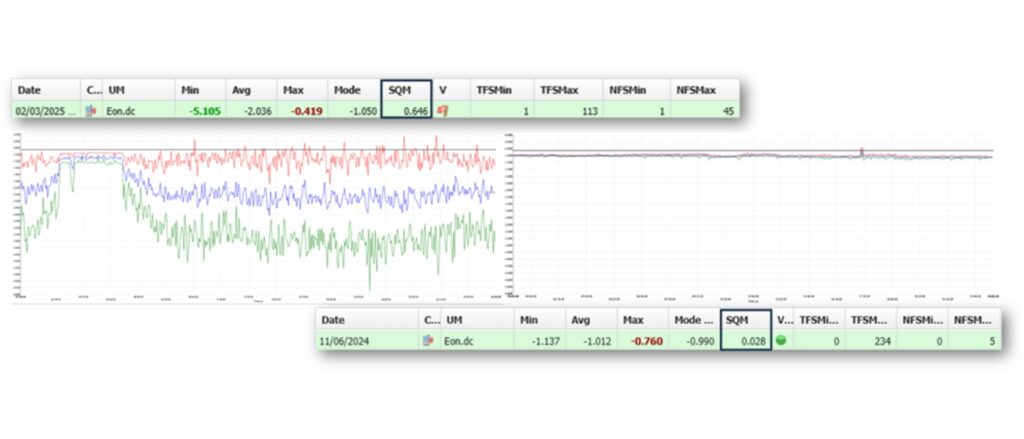
This graph shows four potential trends at four measurement points over six months (one measurement per week).

Monitoraggio delle condotte grafico andamenti potenziale punti misura

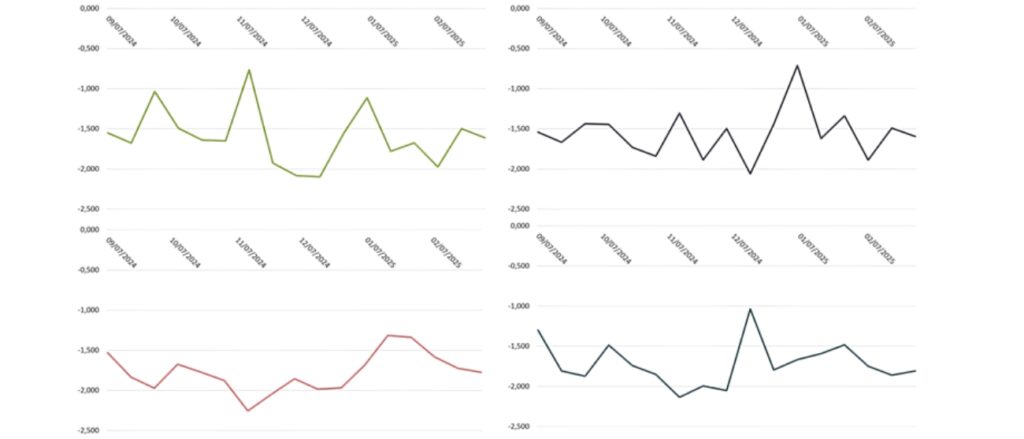
These measurements appear to belong to different cathodic protection systems, but in reality these curves derive from the exact same measurement point but relate to different times: we have the curve for 10:00, 13:00, 20:00 and 21:00 (in the figure below on the left). Therefore, this is what I get when I make a precise measurement with a certain periodicity. I lose track of everything that happens in the meantime: I cannot get clear information on the actual trend, which is what can be seen in the graph on the right.

Monitoraggio delle condotte grafico andamenti potenziale

Remote Data Logger Unit and Edge Computing

To overcome this problem, we need a tool that combines the features of a Remote Monitoring Unit (RMU) and a data logger: a Remote Data Logger Unit. This is a device that not only allows us to combine remote communication with high-frequency monitoring, but is also intelligent, highlighting only the key aspects of the information (indeed, there are constraints in terms of the amount of data that can be sent). The goal is to optimise transmission.

This goal can be achieved through edge computing: a computing model that processes information locally and sends only essential data to the Cloud (daily report). It is therefore a device that, like a data logger, can take one measurement per second at the site where it is placed. With this measurement frequency, at the end of the day, 86,400 measurements will be obtained: being a very high quantity, it is unthinkable to send them all, especially since the device runs on battery.

Therefore, the device processes this information and provides a summary, indicating:

  • Daily minimum, average, maximum: where the average value is a consistent value derived from one measurement per second over the course of the day, making it possible to understand the actual trend (not as in the previous graph on the left).
  • Statistical information: trend, i.e. the most frequent value measured within the 86,400 samples; standard deviation; and variability, to get an idea of how much the measurement varies throughout the day.
  • Total time (seconds) below the minimum threshold and above the maximum threshold during the day: to have a range in which to consider the signal valid or invalid; in the latter case, there will be a series of alarms or conditions to pay attention to.
  • Total number of exceedances of the minimum threshold during the day.
  • Total number of exceedances of the maximum threshold during the day.

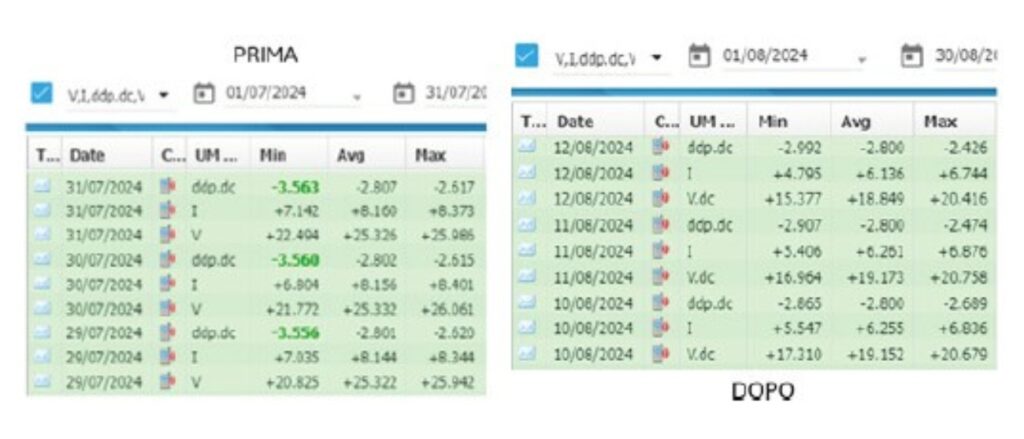
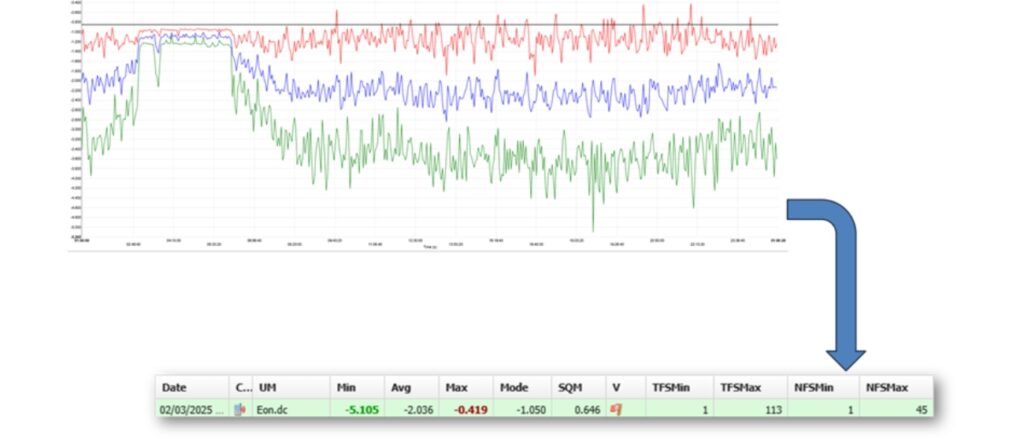
    All this information, which is summarised in sets of numbers (see figure below), is contained in few kilobytes of data per day but tells the story of everything that happened over the 24 hours, and it will do so as long as the device is installed.

    Monitoraggio delle condotte tabella remote datalogger unit

    Read the daily report

    Edge Computing

    In the figure, we see in detail some values.

    Monitoraggio delle condotte report giornaliero Edge Computing

    Min, avg, max

    How can we transform the recording of 24 hours of data into a daily report?

    First of all, we have the following information:

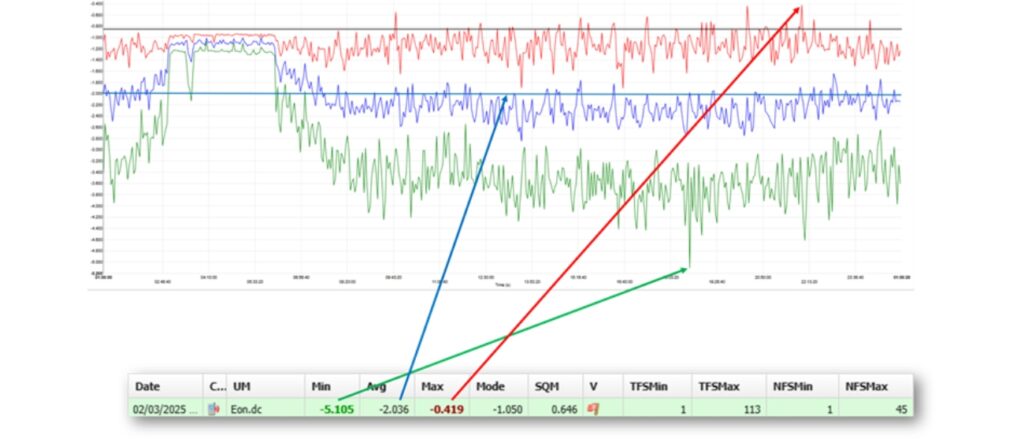
    • Minimum value: the most negative value measured over 24 hours;
    • Average value: given by the arithmetic mean of the samples taken over 24 hours;
    • Maximum value: the most positive value measured over 24 hours.
    Monitoraggio delle condotte Min avg max

    Moda

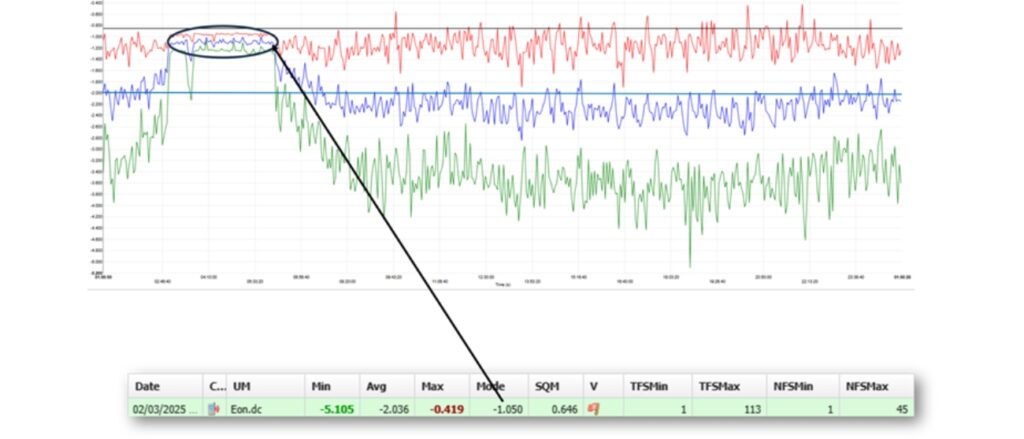
    Arithmetically, trend is the most frequent value within a set of samples (86,400 seconds). Usually, mean and trend have similar values, but when we are faced with a non-stationary interference, such as at a railway crossing (see fig. below), the trend takes on a very particular meaning: during the night hours, we find a slightly more stable measurement range and, almost always, the trend value coincides exactly with the value during the night when the system is not interfered with. Indeed, it is more likely that a value will appear consistently multiple times within that range.

    So, even in a condition where there is considerable variability, it is possible, from these few numbers, also extract information about what the potential is – in the absence of interference – relative to that measurement point.

    Monitoraggio delle condotte moda

    Standard deviation and variability

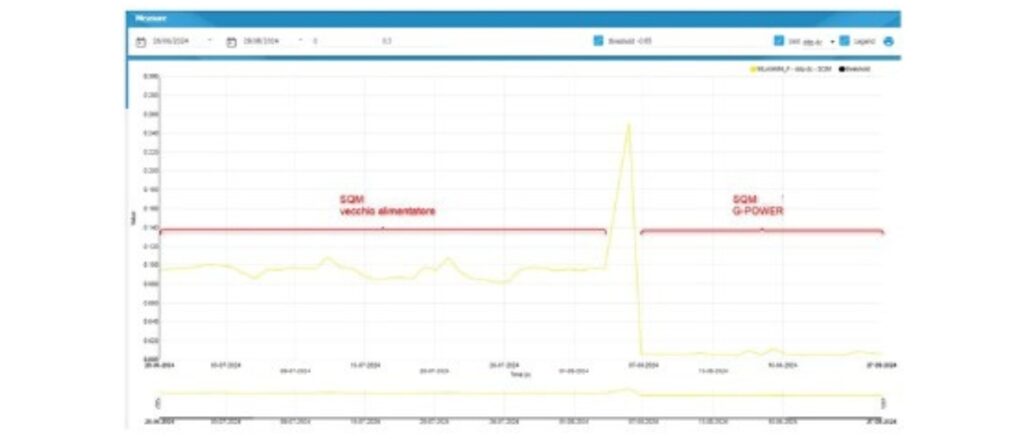
    Looking at the type of graph in the figure below on the left, we would expect the standard deviation (or Mean Square Deviation, MSD) to be quite high. I could have measurements with similar minimum and maximum values, but perhaps due to a single interference that lasted only a few seconds.

    This can be seen from the standard deviation value; indeed, this value indicates how stable my sample population was over the course of 24 hours. Therefore, even if I have rather wide minimum and maximum values as a range, if I realise that I have a low standard deviation (below 0.05), I know that in reality, throughout most of the day, my value has been close to the average value.

    Monitoraggio delle condotte deviazione

    Time and number of alarms

    The daily report also allows us to know how long we have been outside the limit conditions we have set.

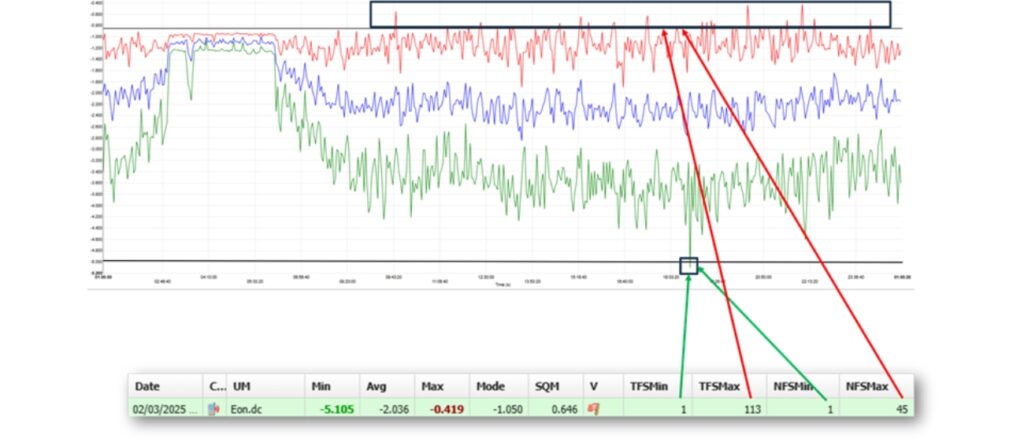
    The minimum out-of-threshold time and the minimum out-of-threshold number provide an overview of how many times you went below that value: in the case shown in the image below, the minimum out-of-threshold was reached once for 1 second. On the other hand, the maximum out-of-threshold time and the maximum out-of-threshold number show how many times one wentabove that value: in the case below, a total maximum out-of-threshold time of less than 2 minutes was reached in forty-five intervals. This, by the way, gives us an idea of the average time out of protection; in this case, we are around 2.5 seconds.

    Why is it crucial? Because by takingcontinuous measurements, I canfind out everything that is happening, and I only need to look at this value to check whether the structure is at risk of corrosion. It is clear that in a condition of continuous cathodic protection, small intervals outside the protection levels do not entail an immediate risk of corrosion: it is up to the technician to decide and set the interval above which it is necessary to be alerted. In any case, in Italy, the regulation has established a maximum value of 3,600 non-continuous seconds.

    Monitoraggio delle condotte Tempo e numero di allarmi

    According to ChatGPT, the term “Edge Computing” started to be known from 2014, but became commonly used around 2017. It is important to note this for a simple reason: everything we have seen so far is what has been done in Italy since 2001 as required by the UNI 10950 standard published that year.

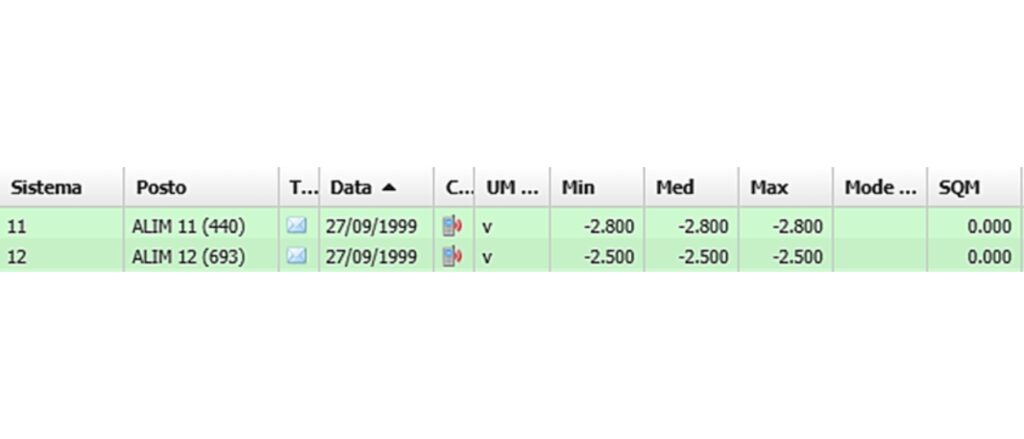
    In the chart below is the first daily report found in our database, which dates back to 1999, proving that we have been doing Edge Computing “without knowing it” for more than 25 years.

    Monitoraggio delle condotte primo report

    AUTOMA designs and produces innovative, Made in Italy hardware and software solutions for remote monitoring and control in the Oil, Gas and Water sectors.

    We were born in 1987 in Italy, and today over 50,000 Automa devices are installed in more than 40 countries around the world.

    Do you want to know the benefits for the security of your networks that you could have with the AUTOMA monitoring system for cathodic protection?

    Contact our team without obligation and we will tell you what we can do to optimise your infrastructure control.

    From the speech “The evolution of the distribution network”
    SMART GRID DAYS 2024, 18 — 19 September 2024.

    Centria is a city distributor that operates in 16 mainly Tuscan provinces (Italy), but with some excursions to Puglia and Umbria, and has collaborations with other companies in the Grosseto area (Lazio region). It has about 6,000 km of gas pipelines, managed mainly at medium and low pressure, and more than 400,000 customers.

    Centria has always wondered if it is possible to make a contribution to decarbonization. Today, cathodic protection also asks itself this question. The distributor would like to make his work more efficient and advanced, despite offering an energy-intensive service.

    In this case, technology comes to the aid: the case studies thatwe present are two examples of interventions carried out on the cathodic protection of two city distribution systems using impressed current. In both cases, an AUTOMA G-POWER device was installed to replace the rectifier previously in operation: in the first case, G-POWER replaced the only rectifier in the system, while in the second it replaced one of the two rectifiers.

    Case 1: The starting situation and the AUTOMA solution

    The system is located in the town of Montale, in the province of Pistoia. It is equipped with 13 km of pipes, of which about 50% medium pressure and 50% low pressure, and a single cathodic protection rectifier, operating at constant potential, with base current.

    The adjustment was made with the Eon potential because it was the only way that that rectifier could work, that is, with a potential of -2.8 V corresponding to about an Eoff of -1.1 V. The base current was 1.30 A that had to be constantly supplied even in conditions of potential lower than that required. The current supplied varied a lot because it is a very interfered system. The variation ranged from 7 A to 12 A, with an average value of about 10.5 A.

    The kilometer extension of the system is quite large, so you start from a fairly flat area and arrive at the first hills. As can be seen from the first image, the pipes are fairly distributed. While in the second image you can see the dislocations of the characteristic and remotely monitored measurement points.

    Verso l'efficienza e l'automazione intelligente nella protezione catodica case study pistoia centria automa territorio

    From the remote control data before replacing the rectifier, you can actually see that the current has values between 7 and 12 A, with an average value around 10 A.

    We removed the rectifier that was previously in operation and replaced it with AUTOMA’s G-POWER. After turning it on, we reset the parameters that were used with the previous rectifier, namely constant potential regulation with an Eon value of -2.8 V. We chose to use G-POWER with the same setting as the previous rectifier to check if there were any operating differences under the same conditions. In the table you can see the new data returned.

    Verso l'efficienza e l'automazione intelligente nella protezione catodica case study pistoia centria automa tabella

    So we haven’t changed either the adjustment system or the system or its surrounding elements. Right from the first ignition we had a fairly unexpected surprise: the current was reduced by almost 25%, going from an average value of 8 A to just over 6 A.

    We asked ourselves why and with AUTOMA we did a bit of analysis on these measures. Let me start by saying that the amount of time we had for analysis was short: the rectifiers were put into operation in the month of July-August 2024, and what you see are preliminary data about two months after the start of the system, in September 2024. But these checks give us hope that we have at least taken the right path.

    Verso l'efficienza e l'automazione intelligente nella protezione catodica case study pistoia centria automa grafico

    Why was there this reduction in power? Going to see the measurements, we noticed that the only thing that has really changed in the data coming from the remote control is the average square deviation from the adjusted value. The difference is important: we went from 0.2 to 0.02. This variation indicates that the regulation is much more stable over time, which translates into a smaller variation in the current supplied and therefore in a more stable and lower current than it was initially.

    Case 2: The starting situation and the AUTOMA solution

    The second system we are talking about is in the town of Sesto Fiorentino (Florence), where Centria has two rectifiers. Of these, only one was replaced during this test because we wanted to see the interaction of G-POWER with other rectifiers.

    Both starting rectifiers operated at constant potential and were both adjusted to -2 V of Eon potential, corresponding to about -1.1 V of Eoff potential. The total current was 13 A, divided more or less equally on the two rectifiers.

    We have about 11 km of mainly medium-pressure network, so we had networks in the fourth species and networks in the sixth species (0.5 bar and 5 bar) in the city center of Sesto Fiorentino, which is a very interfered area with the presence of a railway.

    Verso l'efficienza e l'automazione intelligente nella protezione catodica case study sesto fiorentino centria automa

    Only the rectifier that has been replaced has been set to make the adjustment work on the Eoff potential. We did several tests and then decided to adjust the Eoff potential no longer to -1.1 V (as it was set on previous rectifiers) but to -0.95 V.

    At this point, the second rectifier was turned off because G-POWER was more than enough to protect the entire connected structure. First, the two rectifiers shared the current load (about 6 A/6.5 A each), but with the introduction of AUTOMA’s G-POWER one of the two was completely stopped, while the other supplied about half of the current that was previously supplied in total by two rectifiers.

    The reduction in current in this case was significant, by 50%, both for the adjustment stability of the rectifier and for the lowering of the Eoff potential. Achieving these results is an important goal for a company with environmental certification.

    Let’s mention the ease of installation of the AUTOMA device. G-POWER has also incorporated the data logger, and therefore all its functions: cyclic switch, remote controls, transmission system. It is enough to bring it on site and attach some cables to make it immediately operational, while for the previous rectifiers it was necessary to do a wiring that perhaps in some cases required half a day to connect all the devices. Even a quick installation translates into better efficiency for the company.

    In conclusion, with AUTOMA’s G-POWER we have a product that has better regulation and stability in its operation, which is certainly also due to the fact that it has very new electronics. Clearly, being a new product, its potential is still to be explored. But for the moment we can say that, in addition to a significant simplicity of installation, it also offers a great advantage in the possibility of adjusting on the local Eoff potential.

    AUTOMA designs and produces innovative and Made in Italy hardware and software solutions for remote monitoring and control in the Oil, Gas and Water fields.

    We were founded in 1987 in Italy, and today more than 50,000 Automa devices are installed in more than 40 countries around the world.

    Do you want to know the cathodic protection advantages you could have with the AUTOMA monitoring system?

    Contact our team without obligation and we’ll tell you what we can do to optimize your infrastructure control.

    From the intervention “Cathodic protection. Commissioning of an impressed current system in the presence of non-stationary interference”
    SMART GRID DAYS 2024, 18 – 19 September 2024.

    The INRETE distribution group, part of the Hera Group, is involved in the distribution of gas and electricity in Emilia-Romagna and Tuscany.

    The case study we present concerns the commissioning of a cathodic protection system with impressed current for a distribution structure in the presence of non-stationary interference. Due to the morphology of the structures, this type of setup is extremely dynamic. We will see how the use of AUTOMA technologies, applied to regulation (with a G-POWER installed as the rectifier closest to the interference) and measurement techniques (a G4C-PRO device installed on the second power supply and a G4C-PRO with SOLAR BOX installed at the remote measurement point) can contribute to the efficiency of our plants, regulating them in a more effective way.

    The starting situation

    The system we are examining is a portion of a distribution plant in an urban neighbourhood where there is an interference caused by the nearby electrical substation of a direct current traction system.

    The network, laid in predominantly sandy soil, is protected by two impressed current systems and served by a unidirectional drainage system. The architecture of the grid (qui credo ci vada grid) is mainly meshed, with an extension of about 24 km, and a surface area of slightly over 10,000 m².

    Everything begins with the decommissioning of the unidirectional drainage system.

    The new setup started in 2019 with: determination of the electrical state; assessment of the variability of the electric field; regulation and thus balancing of the electrical system. The new morphology places the two rectifiers (the two diamonds you see in the image – next page) in positions that are very off-center with respect to the detected interference.

    Gestione smart della protezione catodica a corrente impressa

    This means that the urban area closest to the interference registers very evident potential attenuations. We therefore decide to design an impressed current system, determining the variability of the electric field and analysing the most anodic areas, therefore the most suitable for this implementation.

    The impressed current system

    In October 2022 we realised the new impressed current system. Consequently, we also moved on to the implementation across the entire network of new measurement points with polarisation probes. In November 2022, we realised the new electrical setup which, indeed, places the newly designed rectifiers closer to interference.

    Following the new commissioning and the variation of monitored electrical parameters – in compliance with UNI11094 – we reclassified all measurement points. We consequently decided to redo a new commissioning of the entire system, adhering to UNI EN ISO15589-1, starting from a preliminary investigation:

    • Verification of the integrity of the disconnection.
    • Verification of all wiring.
    • Variability of the electric field.
    • Start-up of the system with a checklist of all installations and related safety devices.
    • Start-up of the installations with electrical state settings.
    • Verification of electrical continuity.
    • Rebalancing both the installations and the resistors on our network.
    • Measurements of currents on the joints.

    Consequently, we proceeded to the complete mapping of the entire system.

    Me moved on with the reclassification of measurement points, cartography update, and – a frequently forgotten step – the collection of all these data in a commissioning report, where we recorded the reference values of the electrical state of our system, in accordance with the ISO standard, for comparison with future measurements.

    Our remote monitoring system provides us with the opportunity to report for each individual measurement point its set point following calibration, directing it towards the balancing of the system. As can be seen in the image, this means that, in case of exceeding the set point, the monitoring system creates an anomaly line, from which an intervention order can be generated.

    Gestione smart della protezione catodica a corrente impressa anomalia

    A current impressed system is particularly dynamic and the initial interventions, in addition to the aforementioned decommissioning of the drainage system, have provided the opportunity to improve the system, reducing the current density from 2.7 mA/m² obtained with the first setup in 2017 to about 1.0 mA/m² in 2023.

    The AUTOMA solution to the interference problem

    All these activities have certainly mitigated the issues present in the system, but without resolving the interferences that interact with the rectifier control system.

    Fortunately, technologies are on our side and the adoption of the technique of measuring the Eoff potential (Instant-off) on the most interfered rectifier will prove to be a wise choice.

    The new rectifier, the G-POWER by AUTOMA, has given us the ability to control the system directly based on the Eoff Value, which is the value corrected for the IR component, allowing its PID controller to be less sensitive to potential fluctuations.

    Gestione smart della protezione catodica a corrente impressa G-POWER by AUTOMA

    This is particularly noticeable in the standard deviation of the current output from the rectifier. In this first setup, where both rectifiers operated at variable current, it is possible to see how variable the standard deviation was throughout the day.

    In the subsequent testing phase, we linked the control of the rectifier closest to the interference to a remote E-probe even closer to the interference itself, while the other impressed current system was set to constant current (the visible spikes in the image are due to maintenance activities).

    In the final setup, where the interfered rectifier was set to a local Eoff potential, a flattening of the root mean square deviation can be observed. With this configuration we have effectively halved the standard deviation of the current, a factor that, although less evident but equally interesting, is also noticeable in the root mean square deviation of the DDP E-probe detected at the most characteristic point of our system. Even in this case, there is an almost halving of the value in the phase of controlling the rectifier via local Eoff, which manages to operate at less electro-negative E-probe potentials.

    Gestione smart della protezione catodica a corrente impressa G-POWER by AUTOMA

    AUTOMA designs and produces innovative hardware and software solutions made in Italy for monitoring and remote control in the Oil, Gas and Water sectors.

    We were born in 1987 in Italy, and today over 50,000 Automa devices are installed in more than 40 countries around the world.

    Do you want to know the advantages for the safety of your networks that you could have with the AUTOMA cathodic protection monitoring system?

    Contact our team without obligation and we will tell you what we can do to optimize your infrastructure control.

    Cathodic protection has always been one of the fundamental strategies to slow down the corrosion of underground metal structures, such as pipelines. However, until recently, the techniques adopted to verify its effectiveness were often limited to manual, punctual measurements and not adequately representative of the entire system, especially in the presence of interference.

    Today, thanks to the introduction of advanced technologies, big data and artificial intelligence, cathodic protection monitoring is undergoing a real revolution.

    Traditionally, it was based on surveys carried out at certain points in the network: operators collected periodic readings of the ON potential and, based on these measurements, adjusted the setpoints of the rectifiers. This method, however, showed significant limitations: the values detected represented only an instantaneous measure and did not take into account fluctuations during the day or external interferences, such as stray currents generated by nearby infrastructures.

    With the evolution of networks and the increase in interference, it was understood how necessary a paradigm shift was. This is how AUTOMA created the idea of an intelligent management of the cathodic protection system (Smart CP System): an ecosystem capable of monitoring every point of the network in real time, automatically regulating the current supplied by the cathodic protection rectifiers and predicting critical issues before they turn into concrete problems.

    AUTOMA’s Smart CP System is an innovative approach that combines digital technology, data analysis and artificial intelligence to optimize the operation of the entire cathodic protection system in real time.

    From analog to digital: the Smart CP System, the AUTOMA revolution

    In the past, as we said just above, operators performed spot surveys on specific ‘points’ of the network, manually measuring the ON potential. This data was used to configure rectifiers, often with a high safety margin to compensate for measurement uncertainty and fluctuations over time. The result? Often more current was supplied than necessary, with consequent energy waste and, above all, the risk of overprotection and damage to the coatings.

    In addition, the increase in ground interferences — due to stray currents, electric railway lines, industrial plants or power lines — has made the ON potential less and less reliable as the only reference parameter, or at least considerably more complicated to interpret.

    The Smart CP System was created to overcome these limits. It is a centralized and intelligent management platform that continuously and dynamically controls all components of the cathodic protection system: rectifiers, measuring points, electrodes, and remote control devices. Its objective is twofold: to keep the IR-free protection potential stable and to optimize the output current of the rectifiers, avoiding waste and malfunctions.

    Among the system’s key technologies:

    • RDU (Remote Datalogger Unit) installed at every critical point of the network, able both to function as a remote datalogger and to transmit measurements of the On and IR-free potential in real time.
    • Smart rectifiers, capable of working in a new automatic mode based on IR-free potential.
    • Remote control of the rectifiers, with the possibility of modifying the operating parameters from a central platform.
    • Adaptive algorithms that analyze historical data, seasonality, environmental conditions, and network status to anticipate and solve problems before they occur.

    The heart of the Smart CP System is the new generation of smart rectifiers developed by AUTOMA, capable not only of operating in traditional modes, but also of working on the basis of IR-free potential. Connected to a coupon, these rectifiers constantly measure the real potential of the structure and adapt the current supplied to keep it stable.

    All this is made possible thanks to a digital platform that integrates data analysis, predictive algorithms and remote control.

    Not only that: currently, rectifiers in automatic operating mode base their adjustment on local feedback, but they must guarantee effective protection over the entire extension of the protected structure. For this reason, the possibility of identifying the most critical point (or points) of the network, equipping it with an RDU that allows more frequent communication during the day and connecting this point to the rectifier so that it works and varies its current supply based on the measurements taken by the critical point, opens up a completely new and much smarter opportunity to manage cathodic protection: the possibility of guaranteeing in every moment an effective protection of the entire structure to be protected, while at the same time delivering the minimum current necessary to achieve this purpose.

    Scalable configurations and intelligent algorithms

    The Smart CP system is extremely flexible and can be configured in different ways, depending on the complexity of the infrastructure (number of rectifiers and critical reference points identified):

    • One to one: a rectifier controlled by a remote measuring point.
    • One to many: a rectifier controlled by multiple critical points, with an algorithm that identifies the dominant point for regulation.
    • Many to many: multiple rectifiers interact with a network of measurement points, with an intelligent balancing of the currents.

    There are two main approaches to control algorithms:

    1. Time-based: the platform interrogates devices at regular intervals and adjusts rectifiers based on predefined thresholds.
    2. Event-driven: each measurement point actively communicates to the platform when it detects a significant deviation, triggering immediate action.

    Concrete benefits

    The introduction of the Smart CP system brings tangible advantages:

    • Reduction of energy consumption, thanks to a more precise regulation of the current.
    • Longer anode life, avoiding overprotective conditions, and generally delivering more current than necessary.
    • Proactive corrosion prevention, thanks to the real-time view of the network status.
    • Lower maintenance costs, with targeted and data-based interventions.
    • Greater sustainability of the entire infrastructure system.

    The first field applications confirm the effectiveness of the approach. The Smart CP system is not only a natural technological evolution, but a real paradigm shift: from static and reactive protection to intelligent, predictive and adaptive management of critical infrastructures.

    AUTOMA designs and produces innovative and Made in Italy hardware and software solutions for remote monitoring and control in the Oil, Gas and Water fields.

    We were founded in 1987 in Italy, and today more than 50,000 Automa devices are installed in more than 40 countries around the world.

    Do you want to know the security advantages of your networks that you could have with the AUTOMA cathodic protection monitoring system?

    Contact our team without obligation and we’ll tell you what we can do to optimize your infrastructure control.

    Maintaining the integrity of gas, oil and water pipelines is in many ways a challenge. When infrastructure is located in remote areas that are difficult to reach, or urban but particularly congested, only a remote monitoring system can make realistic assessments of its health and intervene promptly when needed.

    And if the area where the pipelines are located is affected by stray currents, the challenge becomes even more complex, making it essential to have an efficient remote monitoring system for cathodic protection.

    However, the right remote cathodic protection monitoring system can allow you to work more accurately. Here are its benefits.

    1) You can take measurements every second

    A high-performance remote monitoring system gives the possibility to carry out an extremely detailed survey of cathodic protection: it makes it possible to obtain measurements every second throughout the day, every day.

    This provides information that manual measurements in the field could not capture.

    2) You can accurately identify the anomaly that occurred

    The analysis of the data collected by the monitoring system allows you to trace the ‘problem’ that affected the infrastructure.

    For example, the measurements obtained may suggest that the cathodic protection rectifier is not active or that the impressed current anode resistance is increased, or even that there has been damage to unidirectional drainage, which is unable to interrupt the flow of drained current when it reverses its direction.

    Once the anomaly has been identified, taking action to resolve it is much easier and faster: you can program the intervention times and also, if necessary, evaluate how to reschedule periodic maintenance.

    3) You can overcome the problems arising from stray currents

    In areas with time-varying interfering currents, measurements taken on site for a short period (from a few minutes to a few hours) may have difficulty in grasping ‘out of protection’ conditions.

    Remote monitoring, on the other hand, through a daily measurement per second during the 24 hours, offers a real possibility to correctly assess the effects of interfering currents.

    In addition, in areas affected by stray currents, monitoring several signals at a time (On DC and AC potential, IR-free potential) becomes critical to check compliance with the thresholds indicated by the standards and to check the efficiency of all devices installed so as to reduce the effects of interference (DC and AC decouplers, drainage, etc.).

    To measure the IR-free potential, for example, the Eoff can be measured on a coupon. To bring the IR component to zero and thus consider the Eoff a correct approximation of the IR-free potential, the coupon must be chosen with appropriate shape, size, type and material and installed correctly with respect to the reference electrode and pipe. The best choice for correctly measuring is a device with an integrated solid state switch to manage the connection between the pipe and the coupon.

    Having a remote monitoring technology of cathodic protection allows you to view different data in detail, analyse daily measurements automatically and create alarms for anomalies. The more advanced the technology, the more complete the data it provides and the more it will be possible to optimise cathodic protection system management activities, limiting on-site inspections to only those that are really necessary.

    For example, Automa devices record 86,400 data samples for each channel every day (1 measurement per second). Then they send the WebProCat software a daily statistical report and if a problem emerges from the daily report, a complete data log can be requested from the software to identify its source (e.g. AC interference, stray currents, telluric currents, rectifier failures, etc.).

    The WebProCat software by Automa is specifically designed for cathodic protection analysis, such as battery-powered remote monitoring devices with ultra-low power technologies, which guarantee a minimum of 48 months of uninterrupted operation in the field.

    Our company is today a leader in the design and production of innovative and Made in Italy hardware and software solutions for remote monitoring and control in the Oil, Gas and Water sectors.

    Currently, over 50,000 Automa devices are installed in more than 40 countries.

    Do you want to know what security benefits your networks could have with Automa monitoring system of cathodic protection?

    Contact our team without obligation and we will tell you how we can optimise control of your infrastructure.

    What are the variables to take into account when assessing the efficiency of a network cathodic protection system? There are certainly different types and they are all important. But it is equally important to ensure effective monitoring of the system, otherwise any malfunctions may not be communicated in time to be resolved without problems.

    There are three elements that are essential to pay attention to if you want to be sure that you have a remote cathodic protection monitoring and control system that allows you to accurately assess the health of the pipeline and protect it effectively.

    1) Flexibility

    Full adaptability to different situations and needs is an essential requirement for evaluating the efficiency of a cathodic protection monitoring system.

    The connectivity options offered must be comprehensive: an efficient system must support not only mobile communication, but also wired communication and satellite communication to operate even in areas with poor coverage, and must guarantee access to data and their management in total safety, as well as with maximum simplicity and speed. Integration with pre-existing information systems, such as ERP or GIS, is also essential to maintain smooth communication.

    The best monitoring devices also offer additional channels to measure corrosion rates using standard ER probes, providing complete corrosion monitoring capabilities. And the most high-performance cathodic protection monitoring solutions can be equipped with various accessories such as synchronised ON-OFF switches, solar boxes and interfaces for remote control of rectifiers, which further enhance the system’s capabilities and flexibility.

    2) Maintenance

    A latest-generation cathodic protection monitoring system also allows for more efficient and timely maintenance.

    An example of innovative technology in this sense is the Digital Twin, a digital representation of the structure to be protected: thanks to this virtual and real-time updated reproduction of the physical infrastructure, it is possible to carry out continuous monitoring and simulation of the pipeline performance, structural integrity and operating parameters.

    By integrating remote monitoring data, weather forecasts and other relevant information, you can gain insights into potential issues that threaten your facility, enabling predictive maintenance and operational optimisation.

    Improved analysis of collected data allows you to identify deviations from expected patterns, flagging error conditions before they become critical.

    Additionally, continuously collecting data and using it to train algorithms enables early recognition of anomalies or potential problems. This allows you to plan maintenance activities more effectively.

    This translates into important benefits, such as:

    • minimising downtime
    • optimising the allocation of maintenance resources
    • improving the overall safety and reliability of the monitored facility

    3) Power supply

    One of the greatest challenges in cathodic protection is to maintain the monitoring system in a continuously efficient condition. This translates not only into the need to not interrupt the collection and transmission of data in order to receive any alarm signals in real time, but also into the need to guarantee optimal data collection performance even in the event of an external power failure.

    There are solutions that allow the operation of devices in the field to continue even in the event of a power failure, ensuring uninterrupted operation in the field in the absence of electrical power. This is what Automa’s G4C-PRO ensures, a remote cathodic protection monitoring device with ultra-low consumption technology that guarantees a minimum of 48 months of uninterrupted operation in the field with the integrated battery pack.

    Furthermore, from a resource optimisation perspective, a notable benefit for the effectiveness of cathodic protection also comes from the use of Edge-computing, that is, the ability of devices to locally process information collected from the field to guarantee a first level of local intelligence that allows autonomous actions to be carried out even in the temporary absence of the remote communication channel.

    In this way, it is possible to optimise data sending and ensure that the device transmits only the significant information, with an impact on the amount of energy used for communication.

    Automa solutions for remote monitoring of cathodic protection are based on innovative ultra-low consumption technologies to ensure continuous and efficient communication. Our internal battery powered devices ensure a minimum battery life of four years even in adverse communication conditions. While under optimal signal conditions the lithium battery life of our G4C-PRO can easily reach five years.

    Additionally, the G4C-PRO can also be powered by a small solar panel integrated with backup battery, with 10-12 year replacement time.

    At Automa we develop hardware and software solutions for monitoring and remote control of pipeline integrity, in particular for the cathodic protection and the operational management of networks in the Oil, Gas and Water sectors. Our company was founded in 1987 in Italy, and today over 50,000 Automa devices made in Italy are installed in more than 40 countries worldwide.

    Do you want to be sure that your monitoring system provides truly effective cathodic protection and monitors the integrity of your pipelines with maximum efficiency?

    Contact our team without obligation and we will tell you how you can maintain maximum control over your structures!